Every Monday, somebody asks the head of admissions the same question: “Will we fill our seats?” Where the numbers live in a register, a spreadsheet and three counsellors’ heads, the honest answer can take half a day to assemble.
If you want to know how to increase college admissions, start by measuring where applicants are lost. This guide explains what to measure, how to read it, and how a seat forecast is built so you know when to trust it. It connects the CRM measures covered in lead scoring and counsellor assignment and the counsellor follow-up routine with the formal admission stages covered in admission to enrolment in six steps.
The admission funnel: where to start if you want to increase college admissions
An admission funnel counts people at each stage and the share who move on. Use four stages to start.
| Stage | What it counts | Question it answers |
|---|---|---|
| Enquiries | Everyone who asked | Is marketing producing interest? |
| Applications | People who submitted an application | Is follow-up turning interest into action? |
| Offers | People offered a seat | Are applicants meeting eligibility and merit? |
| Enrolments | People who accepted and paid | Do offers convert into students? |
An illustrative funnel
Illustrative numbers, not client data.
| Stage | Count | Conversion from previous stage |
|---|---|---|
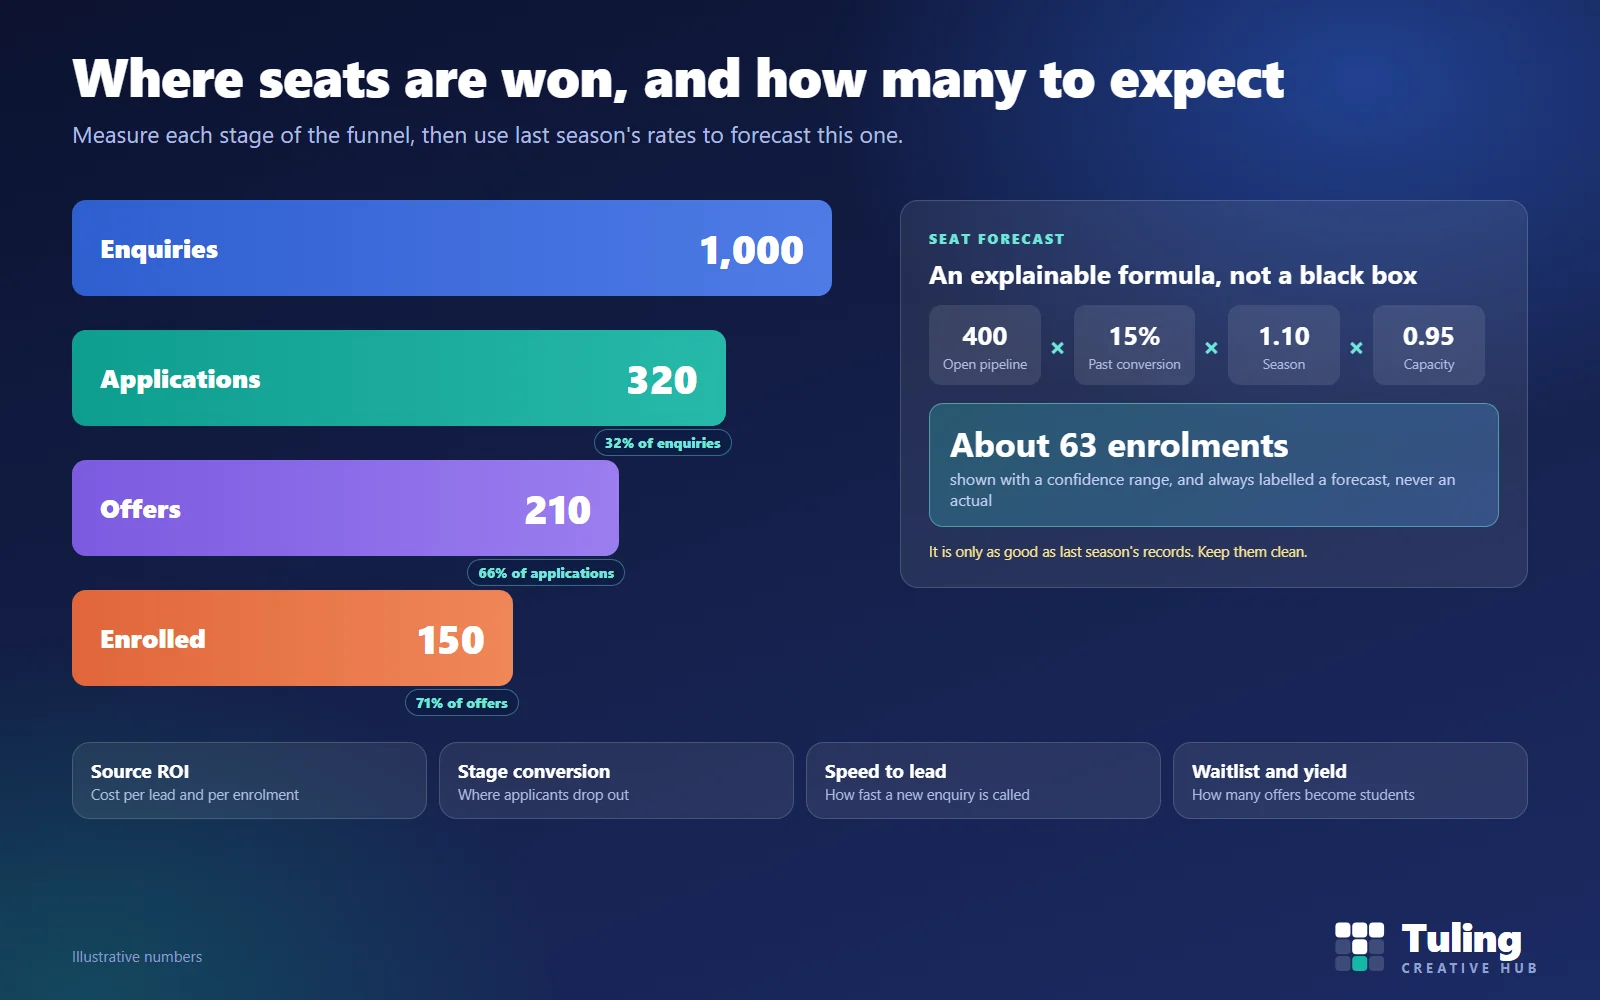
| Enquiries | 1,000 | |
| Applications | 320 | 32% |
| Offers | 210 | 66% |
| Enrolments | 150 | 71% |
The overall rate from enquiry to enrolment is 15%. The number that looks weakest is the first, enquiry to application, which is where follow-up matters. The 71% from offer to enrolment is called yield: of the people offered a seat, how many joined.
Read it per programme. A college-wide 15% hides the fact that MBA may convert at 25% and BCom at 8%. Always cut the funnel by programme, and by source where you can.
The supporting measures
The funnel tells you where people drop out. These measures help explain why.
Speed to lead. The time from enquiry to first contact. A long gap points to assignment or capacity problems. The CRM reports it.
SLA health. The share of leads contacted inside the time you set, for example one hour or one working day.
Stage conversion. Conversion between each pair of stages, shown per programme. This is how you find the stage where applicants are lost.
Source return on spend. For each source, the cost per lead and the cost per enrolment. A source with cheap leads that never enrol is not cheap. The CRM records campaign spend and cost per lead and reports return by source.
Counsellor productivity. Calls and follow-ups logged per person. Use it to see workload, not to rank people, because lead quality differs.
Waitlist and yield. How many applicants are waitlisted and how many move into seats when offers are declined. The admission module reports waitlist and yield, and enrolment by programme and department.
Time to complete. How long applicants take to move through the admission stages. Long delays suggest document or fee bottlenecks.
How the seat forecast works
The Admission CRM can run a baseline forecast of enrolments. It is deliberately simple and explainable:
expected enrolments = open pipeline × historical conversion rate × seasonality factor × capacity factor
- Open pipeline: how many leads or applications are currently open.
- Historical conversion rate: from a look-back over past conversions, comparing how many leads were created to how many enrolled.
- Seasonality factor: an adjustment for the month of the year in an admission cycle.
- Capacity factor: an adjustment for how many seats or how much capacity you have.
The result comes with a confidence range, and it is labelled as a forecast, never as an actual figure.
A worked example
Illustrative numbers, not client data.
A college has 400 open leads in the pipeline. Over the look-back period the conversion rate was 15%. It is a busy month, so the seasonality factor is 1.10. Capacity is slightly constrained, so the capacity factor is 0.95.
400 × 0.15 = 60. Then 60 × 1.10 = 66. Then 66 × 0.95 = 62.7.
The forecast is about 63 enrolments, shown with a range. If your intake target is 80, you know you are about 17 short and can act on marketing, follow-up capacity or offers while there is still time.
Why this is useful and where it fails
It is useful because every number can be explained in a meeting. When the forecast is low, you can see whether it is because the pipeline is small, the conversion rate was low or capacity is limited.
It fails when the inputs are poor:
- Few past records. A new CRM has little history, so the rate is unreliable.
- Leads never closed. If dead leads stay open, the pipeline looks bigger than it is.
- A changed mix. If this year’s leads come from different sources, last year’s rate may not apply.
- Programme differences. One rate for all programmes hides large differences. Forecast per programme where you can.
Treat the forecast as a conversation starter, and compare it with actual enrolments each month.
Scenario 1: the Monday meeting
Illustrative scenario.
A head of admissions opens a report each Monday and sees, for each programme, enquiries, applications, offers and enrolments, and compares them with the seat target and, where it has been run, the latest forecast. BBA is ahead, MBA is behind. She asks the MBA counsellors to review leads with no follow-up in seven days and asks marketing to check the MBA campaign’s cost per enrolment.
The change. The meeting starts with numbers. Before, it started with opinions.
Scenario 2: the campaign that looked cheap
Illustrative numbers.
A college runs two campaigns. Campaign A costs less per lead. Campaign B costs more per lead. At the end of the season, A produced 3 enrolments from 300 leads and B produced 12 from 200 leads.
If the college measured only cost per lead, it would have continued A. Measured per enrolment, B is far cheaper. Source return on spend gives this answer without a spreadsheet.
Scenario 3: a long wait between application and offer
Illustrative scenario.
Stage conversion shows that applications move to offers slowly in one programme. Time to complete is long, and the common stage is document checking. The college adds a second admission officer for that programme during the peak weeks and publishes a clearer document list.
Scenario 4: yield is falling
Illustrative scenario.
Offers are steady, but fewer offered applicants enrol. Waitlist data shows applicants being offered seats late. The college brings forward the offer round, gives a clear payment deadline and offers waitlisted applicants seats sooner when someone declines.
What to try when a number is weak
Suggestions to adapt, not guarantees.
| Weak number | What to try first |
|---|---|
| Few enquiries | Check which sources bring serious leads, and move spend towards them |
| Low enquiry to application | Speed up first contact and tighten the follow-up routine |
| Low application to offer | Look for stuck documents or slow reviews |
| Low offer to enrolment (yield) | Bring the offer round forward, give a clear payment deadline and use the waitlist quickly |
| Forecast below target | Act while there is still time: marketing, follow-up capacity or offers |
Common mistakes
- Measuring only enrolments. You learn the result too late to act.
- Averaging across programmes. One bad programme hides inside a good average.
- Leaving dead leads open. Close leads with a reason so the pipeline is honest.
- Comparing counsellors on conversion alone. Lead quality differs.
- Trusting a forecast without checking it. Compare to actuals monthly.
- Changing definitions mid-season. If “application” means something different in March than in January, trends are meaningless. Write the definitions down.
A simple starter dashboard
If you can track only six numbers each week, track these, per programme:
- New enquiries
- Enquiry-to-application conversion
- Applications to offers
- Offer yield
- Speed to lead
- Forecast against seat target
How Tuling approaches it
Tuling Admissions reports the admission funnel, trends, yield, waitlist and enrolment by programme and department. The Admission CRM adds source return on spend, speed to lead, stage conversion, SLA health, counsellor productivity, workflow health and the seat forecast, and its dashboard is built to answer whether you will fill your seats. The two connect, so an applicant carries their score and source into the admission module. Email is part of the CRM. SMS and WhatsApp are available as a paid integration, set up on request. Pricing is by quote; see how pricing works.
Data protection note
Reports built on personal data should show aggregates by default, limit who can see individual records and be exported only by roles that are allowed to. Do not keep enquiry data longer than you need. See how long to keep student data under DPDP.
How this guide was made
The reports and the forecast formula described here were checked against the working Admission CRM and the admission module. The funnel, the worked forecast and the scenarios use illustrative numbers, not client data. This guide was drafted with AI assistance and reviewed by the Tuling team.
Frequently asked questions
What is an admission funnel?
It is the sequence of stages from first enquiry to enrolled student, with the number of people at each stage and the share who move on to the next. Typical stages are enquiry, application, offer and enrolment.
Which metrics matter most?
Enquiry to application conversion, application to offer conversion, offer to enrolment yield, speed to first contact, source return on spend, and waitlist movement. Track them per programme, not only for the whole college.
How does the Admission CRM forecast enrolments?
It multiplies the open pipeline by the historical conversion rate, a seasonal factor for the time of year and a capacity factor. It shows a confidence range and labels the result as a forecast, not an actual. The conversion rate is taken from a look-back over past conversions.
Why is my forecast wrong?
Common causes are too little history, leads that were never closed in the CRM, a change in marketing mix this year, and a programme whose demand shifted. Clean closed outcomes and review the forecast against actuals every month.
Which reports does Tuling provide?
The admission module reports funnel, trends, yield, waitlist and enrolment by programme and department. The CRM reports source return on spend, speed to lead, stage conversion, SLA health, counsellor productivity and workflow health, and can run the seat forecast.
See the funnel and the forecast on your programmes
We load a sample intake and walk through the funnel report, the source report and the forecast, so you can see which numbers your admissions meeting would use.
Book a demo- Admission software
- Funnel analytics
- Seat forecast
- College admissions